How to install python in windows and use pip in command prompt like mac and ubuntu

These are the steps that have to be followed in order to install python in windows and to be able to install pip commands directly into your command prompt just like mac and ubuntu.

STEP 1

  • check your system settings and find out your system is 32 bit or 64 bit.
  • Accordingly, go to anaconda and download the Individual edition Python 3 (32 or 64bit )(which is open source and completely free).
  • Install the anaconda package just like normal software.
  • During installation, you will get an option under “advanced options” Add Anaconda to my PATH variable” make sure it is checked.

STEP 2

  • After installation, you’ll find anaconda prompt in your all programs
  • open it, and go to the directory where you will host/save your project/program using command “cd
  • In case you have to create a folder for your project you can make a new directory with command “mkdir foldername”
  • after getting into the directory use this command “conda create –name mydevelopment python==3.7.6”
  • press enter and say yes if it asks your permission.
  • after this, you’ll get commands to activate & deactivate (copy/write those commands in a notepad)
  • now type “conda activate mydevelopment”
  • you’ll see (mydevelopment) in your shell.
  • now you can easily use pip install and ls command in your system.

Step 3

  • you are done
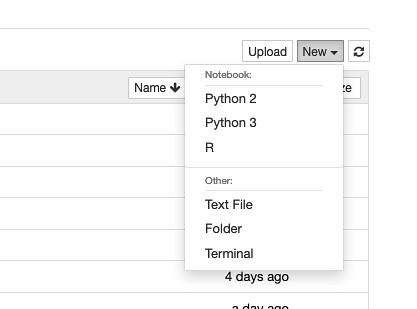
  • you can access the jupyter notebook, spyder  from the anaconda navigator from all programs list
  • additional info to activate the environment if you need to install packages just like you do in Mac and Linux(ubuntu)
  • simply go to the same directory and type“conda activate mydevelopment”
  • to deactivate simply type “conda deactivate”


Visualization: what we see and what we think

How to Deploy D3.js visualization or any .html to heroku

10 steps process to deploy a .html website to Heroku, run these commands on the terminal and make sure you have a Heroku account

    1. Get to the directory: cd YOUR_DIRECTORY
    2. Rename the file to home.html: mv index.html home.html
    3. Create index.php with the line:  echo ‘<? include_once(“home.html”);?>’ > index.php
    4. Create empty composer file: echo ‘{}’ > composer.json
    5. git init
    6. sudo git add .
    7. sudo git commit -m “deploying static–err, dynamic site to heroku”
    8. heroku login
    9. login with your credentials
    10. heroku apps: create YOUR_APP_NAME
    11. git push Heroku master
    12. sudo git add .
    13. git commit -m “a helpful message”
    14. git push heroku master

How to Embed D3.js visualizations in WordPress blog using iFrames

You need to do 2 things before Embedding any D3.js visualization to your self-hosted WordPress blog

  1. Install the iFrame plugin for WordPress.
  2. Host your d3.js visualisation somewhere (so that you can access your visualisation through URL, preferably Heroku: 5 minute process)

After you are done with these two steps just use the iframe tag in the text:

<iframe src=”YOUR_COMPLETE_URL” width=”2000″ height=”800″></iframe>

Optional with Frame Border, Margin Width, Margin Height

<iframe src=”YOUR_COMPLETE_URL” width=”2000″ height=”800″ frameborder=”0″ marginwidth=”0″ marginheight=”0″></iframe>

Example:

Some NLP Frameworks that you can try out today

Bias & Variance in laymen Terms

If the machine learning model is not generalised then the model contains some kind of error.

Error= difference between actual and predicted values/classes

Formulae = sum of (actual output-predicted output), Also Error is the sum of reducible + irreducible error.

Reducible Error= bias + variance

Bias is how far is the predicted values/class from actual values/class. If the predicted value is too far away from actual value then the model is highly biased.

If values are not too far away then its low biased.

If the model is Highly biased then it won’t be able to capture the complex data and hence it UNDERFITS. (Underfitting)

If the model performs well on training dataset but does not perform well on testing or validation data which is new to model then its termed as the variance. So variance is how scattered predicted values from the actual values. If the model has High variance than the model overfits (OVERFITTING).
Oftenly termed as the model learned the noise.

Repository of Natural Language Processing

Python 2 & 3 kernel inside the jupyter notebook

While solving our problems on python, Many of us might have faced the situation of kernels, the specific package supports only python 2.7 and require python 3 and there are a lot of issues while installing python kernels and running it with Jupyter notebook side by side. Here’s my solution of running python 2 and 3 on the same machine.

System Overview: I ran the kernels on MacOS Mojave version 10.14.5

installingpython3kerneljupyter Screenshot 2019-06-03 at 10.10.10 AM
My System Configuration
installingpython3kerneljupyter Screenshot 2019-06-03 at 10.06.31 AM
Step: 1

installingpython3kerneljupyter Screenshot 2019-06-03 at 10.05.55 AM
Step: 2
installingpython3kerneljupyter Screenshot 2019-06-03 at 10.05.17 AM
installingpython3kerneljupyter Screenshot 2019-06-03 at 10.06.31 AM
installingpython3kerneljupyter Screenshot 2019-06-03 at 10.07.52 AM
installingpython3kerneljupyter Screenshot 2019-06-03 at 10.06.46 AM

Its a 2 step process:

  1. Check the available kernels:
    • jupyter kernelspec list
  2. Install the Kernel:
    • python3 -m ipykernel install –user

Repeat 1st step to check the installed kernels.

What is GTFS by the way ?

General Transit Feed Specification
  1. GTFS

General Transit Feed Specification is a common format for public transportation schedules and associated geographic information. It is the data used by google Maps.

2. Details of GTFS

GTFS is a set of text files that represent a snapshot of scheduled transit services

a. Agency.txt – Details of Agency publishing the data

b. Routes.txt – Details of Routes name and type

c. Trips.txt – Details of trip and service

d. Stops.txt – Details of location and stops name

e. Stop_times.txt – Details of arrival & Departure

f.  calender.txt – Details of availability days & dates

including other additional optional fields such as calendar dates, fare attributes, fare rules, shapes, frequencies, transfers, and feed info

Real-time GTFS

1. Trip updates – delays, cancellations, changed routes

2. Service alerts – stop moved, unforeseen events affecting a station, route or the entire network

3. Vehicle positions – information about the vehicles including location and congestion level

ile:GTFS class diagram.svg

3. what are the data we have?

Indian Railways Train Time Table

Data published by:  Ministry of Railways

Source: Data.gov.in

Last updated: 2017

4. when we have GTFS DATA

/Users/Anurag/Desktop/Screenshot 2019-01-31 at 11.31.56 AM.png

Benefits:

To passengers and potential users of higher-quality information on services.

To operators and regulators from the use of analytic and monitoring tools.

To society more generally of operating in an open data ecosystem.

5. Architecture for transit

6. Use case value of application

KMRL – Kochi Metro Rail GTFS

Next Bus Delhi: Android Application of DTC buses

Data used: Delhi Open Transit Data (GTFS)

Case Studies

RPT – Rochester public Transit

BART – BAY AREA ROAD TRANSPORT

CITY OF OREGON

7. How GTFS Transition will help government to do performance check and improvements

  • Transit network Analysis.
  • Defining route service span, travel times, headway, stop amenities, Transfer stations, and Interlined routes.
  • Fare structure
  • Planning functions native to transit agencies including service development.
  • Operational analysis

Resources:

1. https://timesofindia.indiatimes.com/city/delhi/track-your-bus-for-free-as-gps-feeds-go-live/articleshow/66778621.cms

2. https://www.thehindu.com/news/cities/Delhi/catch-a-bus-live-on-this-portal/article25582000.ece

7 Steps of Machine Learning

The 7 steps of any Machine Learning problem to answering questions

  1. Gathering Data
  2. Preparing the Data
  3. Choosing a Model
  4. Training
  5. Evaluation
  6. Hyperparameter Tuning
  7. Prediction


Data Gathering

We will first gather data, in order to train our model we need data for example if we are predicting whether a drink is wine or beer, so we need features like colour and alcohol percentage.

Data Preparation

We will randomise data, we can do Exploratory Data Analysis  that is to check biased that if we might have collected the beer data only that might result in beer biased data.

Data might need duplication, normalisation, error correction

Also to train the model we need to split the data in train & test, the test data will be used for model evaluation.

Choosing a Model

We have lots of models created by researches over the years like some models works good with Image data, some are good at text based data. So we’ll try to choose a model according to our requirement.

Training

Just like when someone is trying to drive a car, first the driver learns how to use brakes &  accelerator & over the time the drivers efficiency improves, the more he trains himself the more efficiency improves.

Y = mX+b

M-slope

B – y’s intercept

X – Input

Y – Output

So the values we can adjust are M & B only, there are lots of M in a model due to many features, so collection of M will be formed in to a matrix and denoted as W weight matrix and similarly for B we arrange the values into a matrix and it will be denoted as B Biases.

So in training we first initialise some random values to the model and try to predict the output with these values, So first the model performs vary poorly but after that we can compare it with the outputs that it should have produced and adjust the values in W & B then we will have more accurate predictions on the next time, each iteration (process of updating W & B) is called one training Step.

Evaluation

In evaluation we test our model against the data which is never been used for training, this metric will allow us to see how model might perform against the data model has not seen yet. That how the model will perform in the real world

A good rule of thumb is to split the data in Training & Evaluation is 80%-20% or 70%-30%.

Parameter Tuning

Predictions